Fund Performance
| Date | ICGF NAV | MSCI ACWI |
|---|---|---|
| 31 Dec 2024 | US$ 639.778 | 841.332 points |
| 29 Nov 2024 | US$ 643.031 | 862.489 points |
| 30 Oct 2024 | US$ 673.599 | 844.940 points |
| 30 Sep 2024 | US$ 714.104 | 851.783 points |
| 30 Aug 2024 | US$ 622.161 | 833.682 points |
| 31 Jul 2024 | US$ 628.326 | 814.155 points |
| 28 Jun 2024 | US$ 629.706 | 802.010 points |
| 31 May 2024 | US$ 626.453 | 785.537 points |
| 30 Apr 2024 | US$ 611.590 | 756.609 points |
| 28 Mar 2024 | US$ 618.464 | 783.172 points |
| 29 Feb 2024 | US$ 639.863 | 761.282 points |
| 31 Jan 2024 | US$ 595.342 | 730.838 points |
| Date | ICGF NAV | MSCI ACWI |
|---|---|---|
| 29 Dec 2023 | US$ 636.894 | 726.996 points |
| 30 Nov 2023 | US$ 628.518 | 694.380 points |
| 31 Oct 2023 | US$ 621.949 | 636.650 points |
| 29 Sep 2023 | US$ 655.007 | 656.820 points |
| 31 Aug 2023 | US$ 660.844 | 686.150 points |
| 31 Jul 2023 | US$ 702.304 | 707.110 points |
| 30 Jun 2023 | US$ 671.169 | 682.840 points |
| 31 May 2023 | US$ 656.318 | 646.380 points |
| 28 Apr 2023 | US$ 682.623 | 655.000 points |
| 31 Mar 2023 | US$ 719.761 | 646.760 points |
| 28 Feb 2023 | US$ 693.973 | 629.020 points |
| 31 Jan 2023 | US$ 750.692 | 648.370 points |
| Date | ICGF NAV | MSCI ACWI |
|---|---|---|
| 30 Dec 2022 | US$676.537 | 605.380 points |
| 30 Nov 2022 | US$654.972 | 630.920 points |
| 31 Oct 2022 | US$564.996 | 586.370 points |
| 30 Sep 2022 | US$608.251 | 553.370 points |
| 31 Aug 2022 | US$678.775 | 613.110 points |
| 29 Jul 2022 | US$671.228 | 637.720 points |
| 30 Jun 2022 | US$720.978 | 596.770 points |
| 31 May 2022 | US$687.335 | 652.810 points |
| 29 Apr 2022 | US$681.812 | 653.670 points |
| 31 Mar 2022 | US$743.851 | 711.560 points |
| 28 Feb 2022 | US$796.415 | 698.020 points |
| 31 Jan 2022 | US$836.069 | 717.380 points |
| Date | ICGF NAV | MSCI ACWI |
|---|---|---|
| 31 Dec 2021 | US$ 882.351 | 754.830 points |
| 30 Nov 2021 | US$ 870.482 | 726.530 points |
| 29 Oct 2021 | US$ 924.802 | 745.230 points |
| 30 Sep 2021 | US$ 899.963 | 709.510 points |
| 31 Aug 2021 | US$ 921.665 | 741.270 points |
| 30 Jul 2021 | US$ 964.801 | 724.210 points |
| 30 Jun 2021 | US$ 1,052.559 | 719.970 points |
| 31 May 2021 | US$1029.460 | 711.450 points |
| 30 Apr 2021 | US$1045.156 | 701.830 points |
| 31 Mar 2021 | US$1028.855 | 673.290 points |
| 26 Feb 2021 | US$1052.016 | 657.150 points |
| 29 Jan 2021 | US$1060.529 | 642.910 points |
| Date | ICGF NAV | MSCI ACWI |
|---|---|---|
| 31 Dec 2020 | US$1,053.545 | 646.270 points |
| 30 Nov 2020 | US$1,052.093 | 618.270 points |
| 31 Oct 2020 | US$1,036.491 | 551.000 points |
| 30 Sep 2020 | US$1,032.925 | 565.150 points |
| 31 Aug 2020 | US$1,016.798 | 584.860 points |
| 30 Jul 2020 | US$998.399 | 551.890 points |
| 30 Jun 2020 | US$922.040 | 524.910 points |
| 29 May 2020 | US$901.357 | 509.470 points |
| 30 Apr 2020 | US$879.619 | 489.170 points |
| 31 Mar 2020 | US$825.608 | 442.350 points |
| 28 Feb 2020 | US$951.255 | 512.760 points |
| 31 Jan 2020 | US$998.719 | 558.620 points |
| Date | ICGF NAV | MSCI ACWI |
|---|---|---|
| 31 Dec 2019 | US$1,050.860 | 565.240 points |
| 29 Nov 2019 | US$1,017.631 | 546.690 points |
| 31 Oct 2019 | US$979.771 | 534.410 points |
| 30 Sep 2019 | US$943.464 | 520.650 points |
| 30 Aug 2019 | US$955.056 | 510.880 points |
| 31 Jul 2019 | US$960.718 | 524.350 points |
| 28 Jun 2019 | US$972.67 | 523.440 points |
| 31 May 2019 | US$916.956 | 492.120 points |
| 30 Apr 2019 | US$1,025.690 | 524.840 points |
| 29 Mar 2019 | US$1,017.478 | 508.550 points |
| 28 Feb 2019 | US$1,016.222 | 503.480 points |
| 31 Jan 2019 | US$971.435 | 491.190 points |
| Date | ICGF NAV | MSCI ACWI |
|---|---|---|
| 31 Dec 2018 | US$943.031 | 455.660 points |
| 30 Nov 2018 | US$958.894 | 490.860 points |
| 31 Oct 2018 | US$925.738 | 484.570 points |
| 28 Sep 2018 | US$1,031.228 | 524.250 points |
| 31 Aug 2018 | US$1,046.325 | 522.880 points |
| 31 Jul 2018 | US$1,080.721 | 519.820 points |
| 29 Jun 2018 | US$1,088.188 | 505.200 points |
| 31 May 2018 | US$1,147.702 | 508.770 points |
| 30 Apr 2018 | US$1,163.818 | 509.690 points |
| 29 Mar 2018 | US$1,177.234 | 505.440 points |
| 28 Feb 2018 | US$1,196.857 | 518.080 points |
| 31 Jan 2018 | US$1,235.126 | 541.670 points |
| Date | ICGF NAV | MSCI ACWI |
|---|---|---|
| 29 Dec 2017 | US$1,180.463 | 513.030 points |
| 30 Nov 2017 | US$1,162.9980 | 505.4400 points |
| 31 Oct 2017 | US$1,173.599 | 496.620 points |
| 29 Sep 2017 | US$1,148.928 | 486.880 points |
| 31 Aug 2017 | US$1,149.092 | 478.410 points |
| 31 Jul 2017 | US$1,155.043 | 477.580 points |
| 30 Jun 2017 | US$1,153.038 | 465.090 points |
| 31 May 2017 | US$1,142.485 | 463.79 points |
| 28 Apr 2017 | US$1,125.345 | 455.170 points |
| 31 Mar 2017 | US$1,114.420 | 448.870 points |
| 28 Feb 2017 | US$1,068.548 | 444.500 points |
| 31 Jan 2017 | US$1,058.852 | 433.130 points |
| Date | ICGF NAV | MSCI ACWI |
|---|---|---|
| 30 Dec 2016 | US$1,026.714 | 421.840 points |
| 30 Nov 2016 | US$1,050.090 | 413.430 points |
| 31 Oct 2016 | US$1,048.668 | 411.010 points |
| 30 Sep 2016 | US$1,044.598 | 418.430 points |
| 31 Aug 2016 | US$1,066.233 | 416.610 points |
| 29 July 2016 | US$1,070.547 | 416.090 points |
| 30 June 2016 | US$1,064.691 | 399.29 points |
| 31 May 2016 | US$1,075.310 | 402.570 points |
| 29 April 2016 | US$1,065.163 | 403.340 points |
| 31 March 2016 | US$1,137.952 | 398.250 points |
| 29 February 2016 | US$1,127.910 | 371.660 points |
| 29 January 2016 | US$1,126.700 | 375.020 points |
| Date | ICGF NAV | MSCI ACWI |
|---|---|---|
| 31 December 2015 | US$1,153.101 | 399.360 points |
| 30 November 2015 | US$1,151.518 | 407.200 points |
| 30 October 2015 | US$1,153.718 | 411.250 points |
| 30 September 2015 | US$1,148.365 | 381.650 points |
| 31 August 2015 | US$1,198.273 | 396.730 points |
| 31 July 2015 | US$1,225.739 | 426.780 points |
| 30 June 2015 | US$1,250.670 | 423.510 points |
| 29 May 2015 | US$1,310.217 | 434.510 points |
| 30 April 2015 | US$1,308.450 | 436.300 points |
| 31 March 2015 | US$1,279.374 | 424.760 points |
| 27 February 2015 | US$1,271.291 | 432.474 points |
| 30 January 2015 | US$1,254.703 | 410.330 points |
| Date | ICGF NAV | MSCI ACWI |
|---|---|---|
| 31 December 2014 | US$1,246.186 | 417.120 points |
| 28 November 2014 | US$1,296.498 | 425.821 points |
| 31 October 2014 | US$1,355.724 | 419.450 points |
| 30 September 2014 | US$1,355.489 | 416.850 points |
| 31 August 2014 | US$1,438.365 | 431.540 points |
| 31 July 2014 | US$1,411.114 | 423.040 points |
| 30 June 2014 | US$1,448.992 | 428.750 points |
| 30 May 2014 | US$1,400.943 | 421.530 points |
| 30 April 2014 | US$1,391.824 | 414.090 points |
| 31 March 2014 | US$1,425.890 | 411.021 points |
| 28 February 2014 | US$1,506.366 | 410.129 points |
| 31 January 2014 | US$1,474.860 | 391.920 points |
| Date | ICGF NAV | MSCI ACWI |
|---|---|---|
| 31 December 2013 | US$1,419.354 | 408.549 points |
| 29 November 2013 | US$1,322.777 | 402.047 points |
| 31 October 2013 | US$1,258.490 | 397.109 points |
| 30 September 2013 | US$1,213.665 | 382.070 points |
| 30 August 2013 | US$1,172.960 | 363.980 points |
| 31 July 2013 | US$1,182.401 | 372.490 points |
| 28 June 2013 | US$1,133.699 | 355.811 points |
| 31 May 2013 | US$1,227.534 | 367.195 points |
| 30 April 2013 | US$1232.645 | 369.422 points |
| 28 March 2013 | US$1233.127 | 359.980 points |
| 28 February 2013 | US$1296.540 | 354.430 points |
| 31 January 2013 | US$1294.893 | 355.100 points |
| Date | ICGF NAV | MSCI ACWI |
|---|---|---|
| 31 December 2012 | US$1206.210 | 339.750 points |
| 30 November 2012 | US$1145.861 | 332.640 points |
| 31 October 2012 | US$1085.778 | 329.070 points |
| 28 September 2012 | US$1084.743 | 331.580 points |
| 31 August 2012 | US$1028.260 | 322.140 points |
| 31 July 2012 | US$1035.729 | 316.020 points |
| 29 June 2012 | US$1064.587 | 312.110 points |
| 31 May 2012 | US$1070.981 | 297.98 points |
| 30 April 2012 | US$1186.538 | 328.670 points |
| 30 March 2012 | US$1189.080 | 333.300 points |
| 29 February 2012 | US$1202.317 | 331.930 points |
| 31 January 2012 | US$1107.386 | 316.650 points |
| Date | ICGF NAV | MSCI ACWI |
|---|---|---|
| 30 December 2011 | US$1067.814 | 299.510 points |
| 30 November 2011 | US$1088.375 | 300.450 points |
| 31 October 2011 | US$1134.710 | 310.410 points |
| 30 September 2011 | US$1050.865 | 280.640 points |
| 31 August 2011 | US$1244.438 | 310.62 points |
| 29 July 2011 | US$1307.912 | 335.90 points |
| 30 June 2011 | US$1322.667 | 341.82 points |
| 31 May 2011 | US$1316.053 | 347.90 points |
| 29 April 2011 | US$1337.908 | 356.90 points |
| 31 March 2011 | US$1304.154 | 343.64 points |
| 28 February 2011 | US$1304.518 | 344.82 points |
| 31 January 2011 | US$1316.369 | 335.58 points |
| Date | ICGF NAV | MSCI ACWI |
|---|---|---|
| 31 December 2010 | US$1295.468 | 330.64 points |
| 30 November 2010 | US$1287.426 | 308.38 points |
| 29 October 2010 | US$1258.765 | 315.95 points |
| 30 September 2010 | US$1198.652 | 305.16 points |
| 31 August 2010 | US$1083.534 | 279.06 points |
| 30 July 2010 | US$1104.226 | 289.75 points |
| 30 June 2010 | US$999.499 | 268.25 points |
| 31 May 2010 | US$1019.620 | 277.17 points |
| 30 April 2010 | US$1119.740 | 307.35 points |
| 31 March 2010 | US$1191.407 | 307.4 points |
| 26 February 2010 | US$1118.591 | 289.5 points |
| 29 January 2010 | US$1097.301 | 286.33 points |
| Date | ICGF NAV | MSCI ACWI |
|---|---|---|
| 31 December 2009 | US$1173.803 | 299.44 points |
| 30 November 2009 | US$1265.080 | 293.67 points |
| 30 October 2009 | US$1196.255 | 282.59 points |
| 30 September 2009 | US$1140.844 | 287.23 points |
| 31 August 2009 | US$1085.287 | 275.1 points |
| 31 July 2009 | US$1147.096 | 266.14 points |
| 30 June 2009 | US$1030.655 | 244.9 points |
| 31 May 2009 | US$993.237 | 246.69 points |
| 30 April 2009 | US$830.481 | 225.24 points |
| 31 March 2009 | US$694.317 | 202.04 points |
| 28 February 2009 | US$655.787 | 187.17 points |
| 31 January 2009 | US$672.788 | 208.02 points |
| Date | ICGF NAV | MSCI ACWI |
|---|---|---|
| 31 December 2008 | US$695.955 | 227.68 points |
| 30 November 2008 | US$653.250 | 220.05 points |
| 31 October 2008 | US$678.801 | 236.11 points |
| 30 September 2008 | US$799.177 | 295.18 points |
| 31 August 2008 | US$897.862 | 337.61 points |
| 31 July 2008 | US$945.143 | 345.75 points |
| 30 June 2008 | US$989.865 | 355.4 points |
| 31 May 2008 | US$1073.420 | 387.75 points |
| 30 April 2008 | US$1063.791 | 383.3 points |
| 31 March 2008 | US$1008.262 | 363.99 points |
| 29 February 2008 | US$1015.721 | 370.41 points |
| 31 January 2008 | US$993.382 | 369.93 points |
| Date | ICGF NAV | MSCI ACWI |
|---|---|---|
| 31 December 2007 | US$1064.527 | 403.25 points |
| 30 November 2007 | US$1072.833 | 408.1 points |
| 31 October 2007 | US$1127.180 | 427.63 points |
| 30 September 2007 | US$1039.706 | 411.92 points |
| 31 August 2007 | US$999.979 | 391.49 points |
| 31 July 2007 | US$993.526 | 393.34 points |
NOTE:
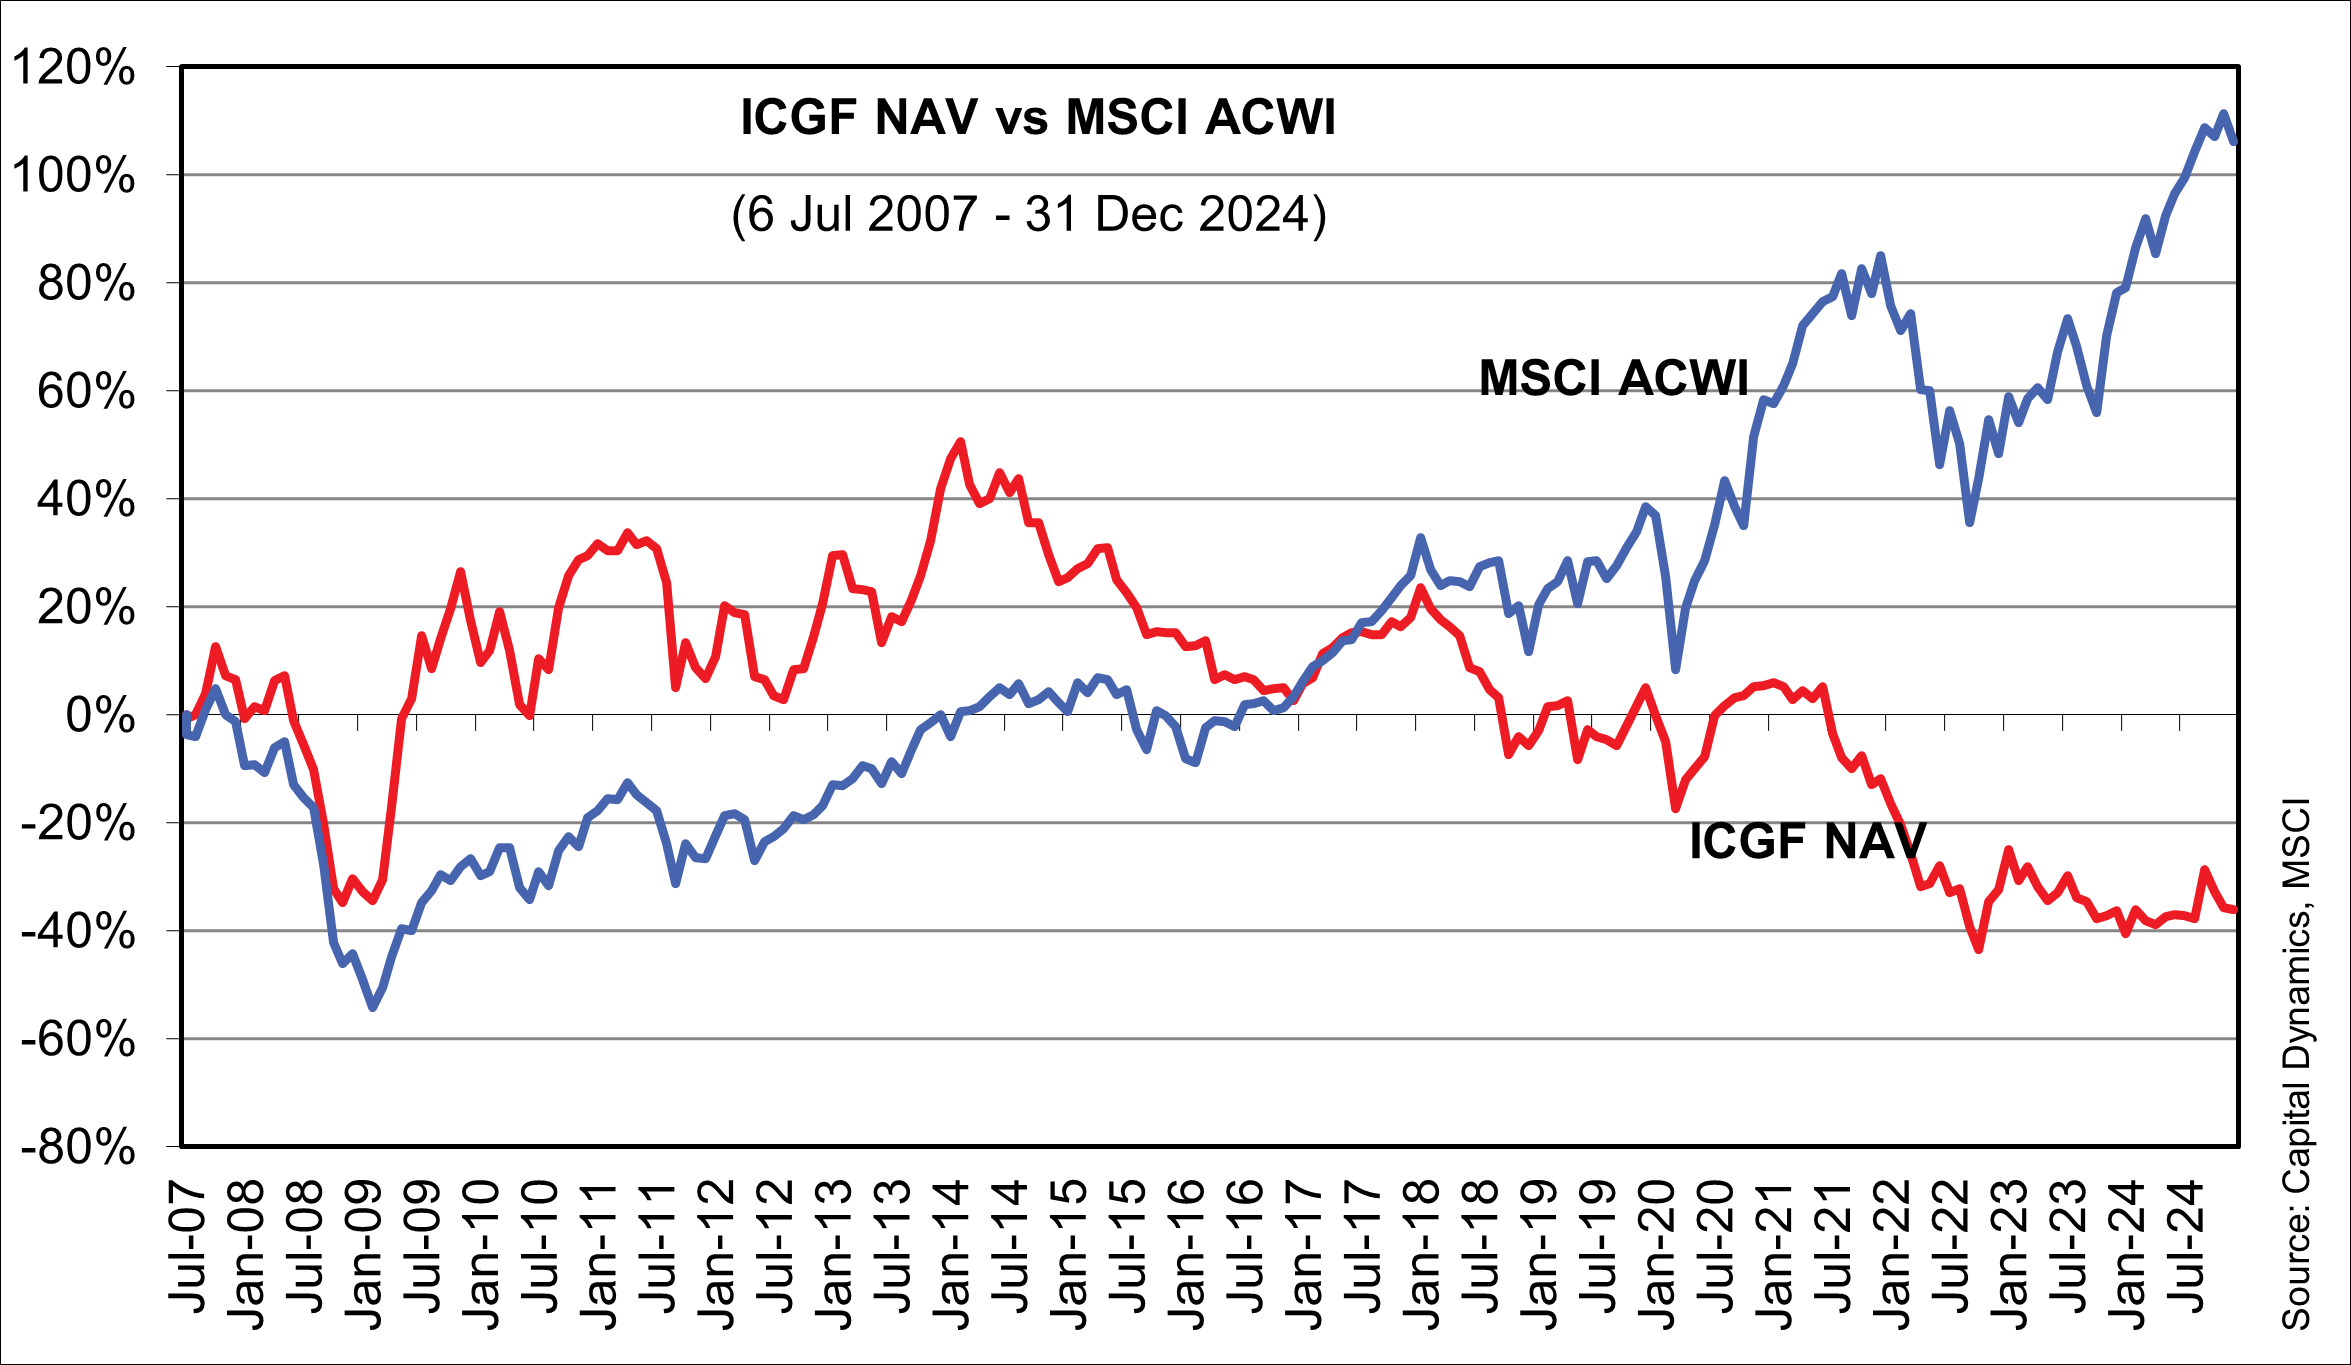
ICGF = The i Capital Global Fund.
MSCI ACWI Index: A free float-adjusted market capitalization weighted index which consists of 45 country indices, comprising 24 developed and 21 emerging market country indices.
Table 2: Cumulative % Change
| 6 July 2007 | 31 Dec 2024 | Cumulative Change % | Compound Return | |
| ICGF | US$1000.000 | US$ 639.778 | -36.02 | -2.52 |
| MSCI ACWI | 407.960 points | 841.332 points | 106.23 | 4.22 |