i Capital Global Fund
Incorporation
Domicile: Cayman Islands
Date of Incorporation: 6 Feb 2007
Fiscal Year end: 30 April
Type: Open-end structure
Minimum Investment
Minimum initial investment: US$100,000
Minimum subsequent investment: US$10,000
Subscription and Redemption
Subscription: Anytime, pricing will be based on the month-end NAV.
Lock-in period: 1 year
Redemption: Mar, Jun, Sep, Dec
Redemption notice: Minimum 2 months before redemption quarter.
Minimum redemption: US$10,000
Fee structure
Loadings: Zero
Management fee: 1.5% p.a. (payable quarterly)
Performance fee: Chargeable if the Fund’s NAV meets the following 2 criteria:
i) NAV exceeds 6% annual rate of return and
ii) NAV exceeds 6% annual compound rate of return
The performance fee will be 20% of the amount exceeding 6% of net annual rate of return.
i Capital Global Fund operates under the purview of the Cayman Islands Monetary Authority (CIMA). The CIMA’s main functions are to maintain a sound financial system, to promote and enhance market confidence and to protect the consumer and the reputation of the Cayman Islands as a financial centre. The Authority’s existence ensures the development and implementation of a regulatory regime which complies with international expectations and also enhances the competitiveness of Cayman Islands as one of the largest financial centres of the world.
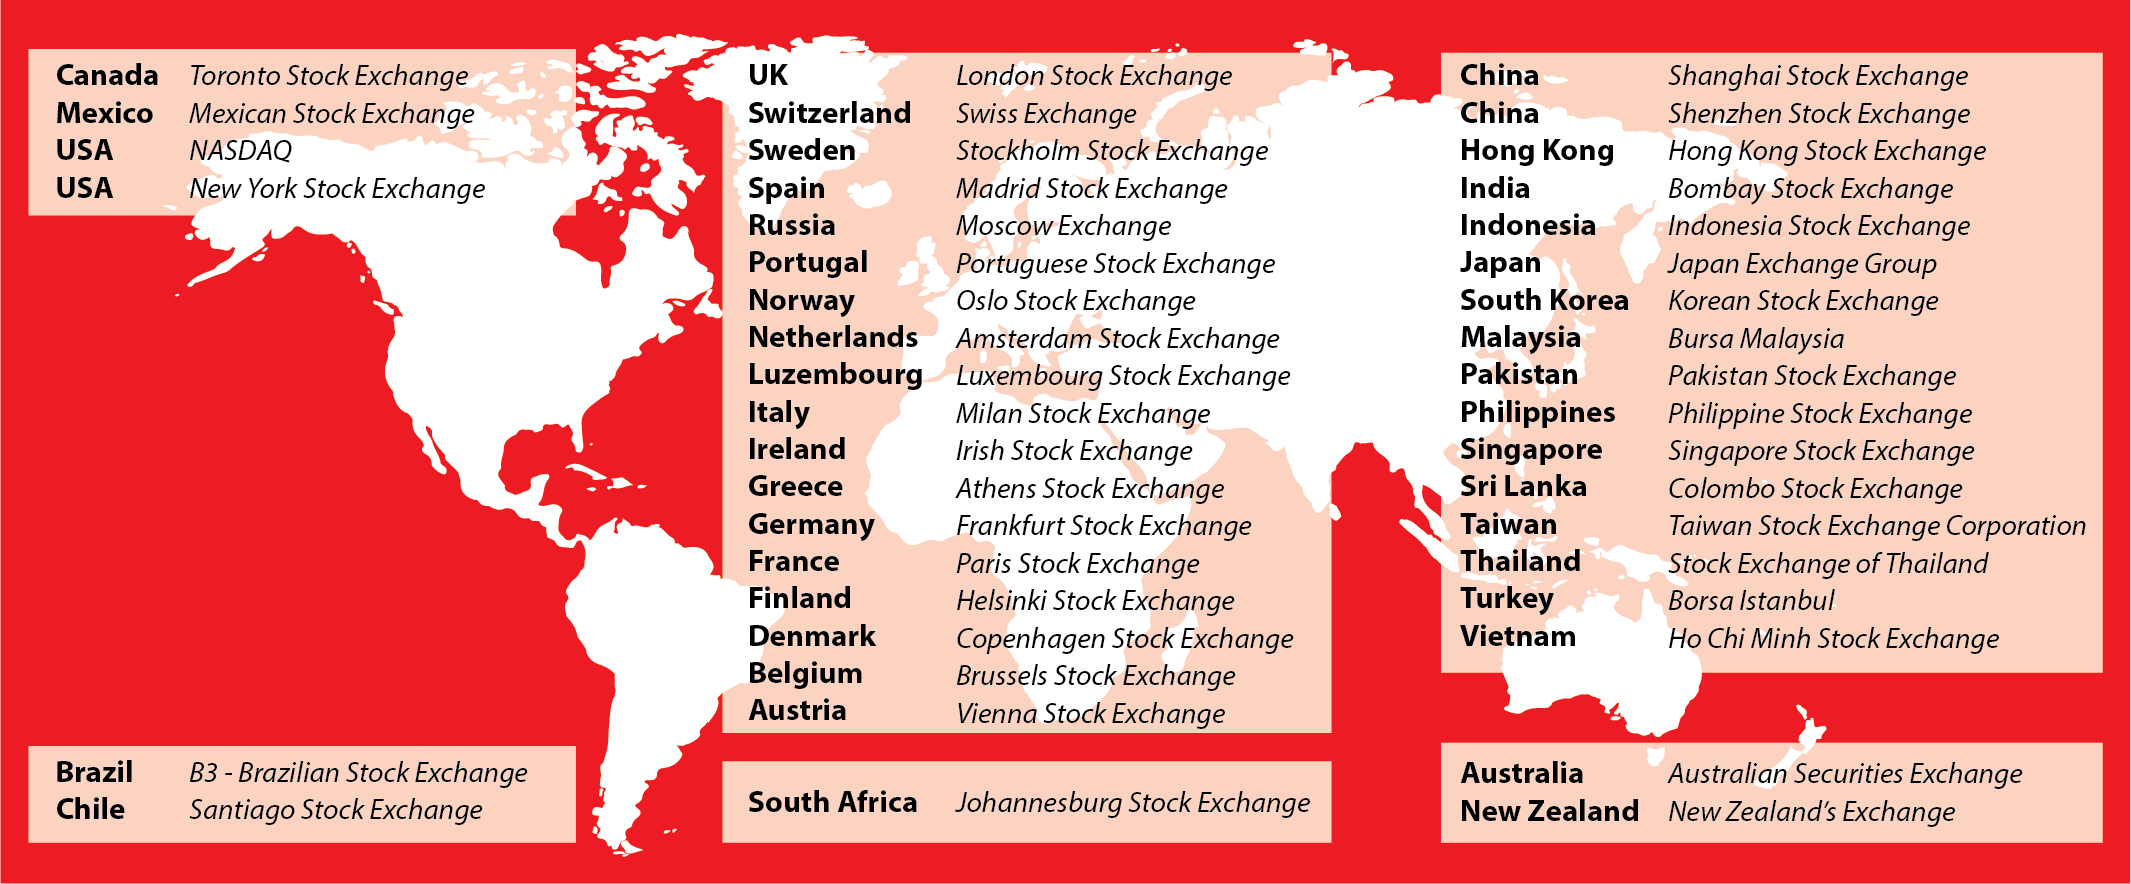
Capital Dynamics (S) Pte Ltd (CDPL) invests in 43 stock markets globally from 41 countries.
You buy and sell based on its NAV and you do not have to pay entry or exit fees. As no agents or distributors are appointed for the i Capital Global Fund, investors can invest in it only through Capital Dynamics (S) Pte Ltd.
Our contacts are:
| : | cdpl@icapital.biz | |
| Telephone | : | 65-62248055/56/58 |
| Fax | : | 65-62248057 |
| Address | : | No. 112 Robinson Road # 11-02 , Robinson 112 Singapore 068902 |
Fund Performance
| Date | ICGF NAV | MSCI ACWI |
|---|---|---|
| 31 Dec 2024 | US$ 639.778 | 841.332 points |
| 29 Nov 2024 | US$ 643.031 | 862.489 points |
| 30 Oct 2024 | US$ 673.599 | 844.940 points |
| 30 Sep 2024 | US$ 714.104 | 851.783 points |
| 30 Aug 2024 | US$ 622.161 | 833.682 points |
| 31 Jul 2024 | US$ 628.326 | 814.155 points |
| 28 Jun 2024 | US$ 629.706 | 802.010 points |
| 31 May 2024 | US$ 626.453 | 785.537 points |
| 30 Apr 2024 | US$ 611.590 | 756.609 points |
| 28 Mar 2024 | US$ 618.464 | 783.172 points |
| 29 Feb 2024 | US$ 639.863 | 761.282 points |
| 31 Jan 2024 | US$ 595.342 | 730.838 points |
| Date | ICGF NAV | MSCI ACWI |
|---|---|---|
| 29 Dec 2023 | US$ 636.894 | 726.996 points |
| 30 Nov 2023 | US$ 628.518 | 694.380 points |
| 31 Oct 2023 | US$ 621.949 | 636.650 points |
| 29 Sep 2023 | US$ 655.007 | 656.820 points |
| 31 Aug 2023 | US$ 660.844 | 686.150 points |
| 31 Jul 2023 | US$ 702.304 | 707.110 points |
| 30 Jun 2023 | US$ 671.169 | 682.840 points |
| 31 May 2023 | US$ 656.318 | 646.380 points |
| 28 Apr 2023 | US$ 682.623 | 655.000 points |
| 31 Mar 2023 | US$ 719.761 | 646.760 points |
| 28 Feb 2023 | US$ 693.973 | 629.020 points |
| 31 Jan 2023 | US$ 750.692 | 648.370 points |
| Date | ICGF NAV | MSCI ACWI |
|---|---|---|
| 30 Dec 2022 | US$676.537 | 605.380 points |
| 30 Nov 2022 | US$654.972 | 630.920 points |
| 31 Oct 2022 | US$564.996 | 586.370 points |
| 30 Sep 2022 | US$608.251 | 553.370 points |
| 31 Aug 2022 | US$678.775 | 613.110 points |
| 29 Jul 2022 | US$671.228 | 637.720 points |
| 30 Jun 2022 | US$720.978 | 596.770 points |
| 31 May 2022 | US$687.335 | 652.810 points |
| 29 Apr 2022 | US$681.812 | 653.670 points |
| 31 Mar 2022 | US$743.851 | 711.560 points |
| 28 Feb 2022 | US$796.415 | 698.020 points |
| 31 Jan 2022 | US$836.069 | 717.380 points |
| Date | ICGF NAV | MSCI ACWI |
|---|---|---|
| 31 Dec 2021 | US$ 882.351 | 754.830 points |
| 30 Nov 2021 | US$ 870.482 | 726.530 points |
| 29 Oct 2021 | US$ 924.802 | 745.230 points |
| 30 Sep 2021 | US$ 899.963 | 709.510 points |
| 31 Aug 2021 | US$ 921.665 | 741.270 points |
| 30 Jul 2021 | US$ 964.801 | 724.210 points |
| 30 Jun 2021 | US$ 1,052.559 | 719.970 points |
| 31 May 2021 | US$1029.460 | 711.450 points |
| 30 Apr 2021 | US$1045.156 | 701.830 points |
| 31 Mar 2021 | US$1028.855 | 673.290 points |
| 26 Feb 2021 | US$1052.016 | 657.150 points |
| 29 Jan 2021 | US$1060.529 | 642.910 points |
| Date | ICGF NAV | MSCI ACWI |
|---|---|---|
| 31 Dec 2020 | US$1,053.545 | 646.270 points |
| 30 Nov 2020 | US$1,052.093 | 618.270 points |
| 31 Oct 2020 | US$1,036.491 | 551.000 points |
| 30 Sep 2020 | US$1,032.925 | 565.150 points |
| 31 Aug 2020 | US$1,016.798 | 584.860 points |
| 30 Jul 2020 | US$998.399 | 551.890 points |
| 30 Jun 2020 | US$922.040 | 524.910 points |
| 29 May 2020 | US$901.357 | 509.470 points |
| 30 Apr 2020 | US$879.619 | 489.170 points |
| 31 Mar 2020 | US$825.608 | 442.350 points |
| 28 Feb 2020 | US$951.255 | 512.760 points |
| 31 Jan 2020 | US$998.719 | 558.620 points |
| Date | ICGF NAV | MSCI ACWI |
|---|---|---|
| 31 Dec 2019 | US$1,050.860 | 565.240 points |
| 29 Nov 2019 | US$1,017.631 | 546.690 points |
| 31 Oct 2019 | US$979.771 | 534.410 points |
| 30 Sep 2019 | US$943.464 | 520.650 points |
| 30 Aug 2019 | US$955.056 | 510.880 points |
| 31 Jul 2019 | US$960.718 | 524.350 points |
| 28 Jun 2019 | US$972.67 | 523.440 points |
| 31 May 2019 | US$916.956 | 492.120 points |
| 30 Apr 2019 | US$1,025.690 | 524.840 points |
| 29 Mar 2019 | US$1,017.478 | 508.550 points |
| 28 Feb 2019 | US$1,016.222 | 503.480 points |
| 31 Jan 2019 | US$971.435 | 491.190 points |
| Date | ICGF NAV | MSCI ACWI |
|---|---|---|
| 31 Dec 2018 | US$943.031 | 455.660 points |
| 30 Nov 2018 | US$958.894 | 490.860 points |
| 31 Oct 2018 | US$925.738 | 484.570 points |
| 28 Sep 2018 | US$1,031.228 | 524.250 points |
| 31 Aug 2018 | US$1,046.325 | 522.880 points |
| 31 Jul 2018 | US$1,080.721 | 519.820 points |
| 29 Jun 2018 | US$1,088.188 | 505.200 points |
| 31 May 2018 | US$1,147.702 | 508.770 points |
| 30 Apr 2018 | US$1,163.818 | 509.690 points |
| 29 Mar 2018 | US$1,177.234 | 505.440 points |
| 28 Feb 2018 | US$1,196.857 | 518.080 points |
| 31 Jan 2018 | US$1,235.126 | 541.670 points |
| Date | ICGF NAV | MSCI ACWI |
|---|---|---|
| 29 Dec 2017 | US$1,180.463 | 513.030 points |
| 30 Nov 2017 | US$1,162.9980 | 505.4400 points |
| 31 Oct 2017 | US$1,173.599 | 496.620 points |
| 29 Sep 2017 | US$1,148.928 | 486.880 points |
| 31 Aug 2017 | US$1,149.092 | 478.410 points |
| 31 Jul 2017 | US$1,155.043 | 477.580 points |
| 30 Jun 2017 | US$1,153.038 | 465.090 points |
| 31 May 2017 | US$1,142.485 | 463.79 points |
| 28 Apr 2017 | US$1,125.345 | 455.170 points |
| 31 Mar 2017 | US$1,114.420 | 448.870 points |
| 28 Feb 2017 | US$1,068.548 | 444.500 points |
| 31 Jan 2017 | US$1,058.852 | 433.130 points |
| Date | ICGF NAV | MSCI ACWI |
|---|---|---|
| 30 Dec 2016 | US$1,026.714 | 421.840 points |
| 30 Nov 2016 | US$1,050.090 | 413.430 points |
| 31 Oct 2016 | US$1,048.668 | 411.010 points |
| 30 Sep 2016 | US$1,044.598 | 418.430 points |
| 31 Aug 2016 | US$1,066.233 | 416.610 points |
| 29 July 2016 | US$1,070.547 | 416.090 points |
| 30 June 2016 | US$1,064.691 | 399.29 points |
| 31 May 2016 | US$1,075.310 | 402.570 points |
| 29 April 2016 | US$1,065.163 | 403.340 points |
| 31 March 2016 | US$1,137.952 | 398.250 points |
| 29 February 2016 | US$1,127.910 | 371.660 points |
| 29 January 2016 | US$1,126.700 | 375.020 points |
| Date | ICGF NAV | MSCI ACWI |
|---|---|---|
| 31 December 2015 | US$1,153.101 | 399.360 points |
| 30 November 2015 | US$1,151.518 | 407.200 points |
| 30 October 2015 | US$1,153.718 | 411.250 points |
| 30 September 2015 | US$1,148.365 | 381.650 points |
| 31 August 2015 | US$1,198.273 | 396.730 points |
| 31 July 2015 | US$1,225.739 | 426.780 points |
| 30 June 2015 | US$1,250.670 | 423.510 points |
| 29 May 2015 | US$1,310.217 | 434.510 points |
| 30 April 2015 | US$1,308.450 | 436.300 points |
| 31 March 2015 | US$1,279.374 | 424.760 points |
| 27 February 2015 | US$1,271.291 | 432.474 points |
| 30 January 2015 | US$1,254.703 | 410.330 points |
| Date | ICGF NAV | MSCI ACWI |
|---|---|---|
| 31 December 2014 | US$1,246.186 | 417.120 points |
| 28 November 2014 | US$1,296.498 | 425.821 points |
| 31 October 2014 | US$1,355.724 | 419.450 points |
| 30 September 2014 | US$1,355.489 | 416.850 points |
| 31 August 2014 | US$1,438.365 | 431.540 points |
| 31 July 2014 | US$1,411.114 | 423.040 points |
| 30 June 2014 | US$1,448.992 | 428.750 points |
| 30 May 2014 | US$1,400.943 | 421.530 points |
| 30 April 2014 | US$1,391.824 | 414.090 points |
| 31 March 2014 | US$1,425.890 | 411.021 points |
| 28 February 2014 | US$1,506.366 | 410.129 points |
| 31 January 2014 | US$1,474.860 | 391.920 points |
| Date | ICGF NAV | MSCI ACWI |
|---|---|---|
| 31 December 2013 | US$1,419.354 | 408.549 points |
| 29 November 2013 | US$1,322.777 | 402.047 points |
| 31 October 2013 | US$1,258.490 | 397.109 points |
| 30 September 2013 | US$1,213.665 | 382.070 points |
| 30 August 2013 | US$1,172.960 | 363.980 points |
| 31 July 2013 | US$1,182.401 | 372.490 points |
| 28 June 2013 | US$1,133.699 | 355.811 points |
| 31 May 2013 | US$1,227.534 | 367.195 points |
| 30 April 2013 | US$1232.645 | 369.422 points |
| 28 March 2013 | US$1233.127 | 359.980 points |
| 28 February 2013 | US$1296.540 | 354.430 points |
| 31 January 2013 | US$1294.893 | 355.100 points |
| Date | ICGF NAV | MSCI ACWI |
|---|---|---|
| 31 December 2012 | US$1206.210 | 339.750 points |
| 30 November 2012 | US$1145.861 | 332.640 points |
| 31 October 2012 | US$1085.778 | 329.070 points |
| 28 September 2012 | US$1084.743 | 331.580 points |
| 31 August 2012 | US$1028.260 | 322.140 points |
| 31 July 2012 | US$1035.729 | 316.020 points |
| 29 June 2012 | US$1064.587 | 312.110 points |
| 31 May 2012 | US$1070.981 | 297.98 points |
| 30 April 2012 | US$1186.538 | 328.670 points |
| 30 March 2012 | US$1189.080 | 333.300 points |
| 29 February 2012 | US$1202.317 | 331.930 points |
| 31 January 2012 | US$1107.386 | 316.650 points |
| Date | ICGF NAV | MSCI ACWI |
|---|---|---|
| 30 December 2011 | US$1067.814 | 299.510 points |
| 30 November 2011 | US$1088.375 | 300.450 points |
| 31 October 2011 | US$1134.710 | 310.410 points |
| 30 September 2011 | US$1050.865 | 280.640 points |
| 31 August 2011 | US$1244.438 | 310.62 points |
| 29 July 2011 | US$1307.912 | 335.90 points |
| 30 June 2011 | US$1322.667 | 341.82 points |
| 31 May 2011 | US$1316.053 | 347.90 points |
| 29 April 2011 | US$1337.908 | 356.90 points |
| 31 March 2011 | US$1304.154 | 343.64 points |
| 28 February 2011 | US$1304.518 | 344.82 points |
| 31 January 2011 | US$1316.369 | 335.58 points |
| Date | ICGF NAV | MSCI ACWI |
|---|---|---|
| 31 December 2010 | US$1295.468 | 330.64 points |
| 30 November 2010 | US$1287.426 | 308.38 points |
| 29 October 2010 | US$1258.765 | 315.95 points |
| 30 September 2010 | US$1198.652 | 305.16 points |
| 31 August 2010 | US$1083.534 | 279.06 points |
| 30 July 2010 | US$1104.226 | 289.75 points |
| 30 June 2010 | US$999.499 | 268.25 points |
| 31 May 2010 | US$1019.620 | 277.17 points |
| 30 April 2010 | US$1119.740 | 307.35 points |
| 31 March 2010 | US$1191.407 | 307.4 points |
| 26 February 2010 | US$1118.591 | 289.5 points |
| 29 January 2010 | US$1097.301 | 286.33 points |
| Date | ICGF NAV | MSCI ACWI |
|---|---|---|
| 31 December 2009 | US$1173.803 | 299.44 points |
| 30 November 2009 | US$1265.080 | 293.67 points |
| 30 October 2009 | US$1196.255 | 282.59 points |
| 30 September 2009 | US$1140.844 | 287.23 points |
| 31 August 2009 | US$1085.287 | 275.1 points |
| 31 July 2009 | US$1147.096 | 266.14 points |
| 30 June 2009 | US$1030.655 | 244.9 points |
| 31 May 2009 | US$993.237 | 246.69 points |
| 30 April 2009 | US$830.481 | 225.24 points |
| 31 March 2009 | US$694.317 | 202.04 points |
| 28 February 2009 | US$655.787 | 187.17 points |
| 31 January 2009 | US$672.788 | 208.02 points |
| Date | ICGF NAV | MSCI ACWI |
|---|---|---|
| 31 December 2008 | US$695.955 | 227.68 points |
| 30 November 2008 | US$653.250 | 220.05 points |
| 31 October 2008 | US$678.801 | 236.11 points |
| 30 September 2008 | US$799.177 | 295.18 points |
| 31 August 2008 | US$897.862 | 337.61 points |
| 31 July 2008 | US$945.143 | 345.75 points |
| 30 June 2008 | US$989.865 | 355.4 points |
| 31 May 2008 | US$1073.420 | 387.75 points |
| 30 April 2008 | US$1063.791 | 383.3 points |
| 31 March 2008 | US$1008.262 | 363.99 points |
| 29 February 2008 | US$1015.721 | 370.41 points |
| 31 January 2008 | US$993.382 | 369.93 points |
| Date | ICGF NAV | MSCI ACWI |
|---|---|---|
| 31 December 2007 | US$1064.527 | 403.25 points |
| 30 November 2007 | US$1072.833 | 408.1 points |
| 31 October 2007 | US$1127.180 | 427.63 points |
| 30 September 2007 | US$1039.706 | 411.92 points |
| 31 August 2007 | US$999.979 | 391.49 points |
| 31 July 2007 | US$993.526 | 393.34 points |
NOTE:
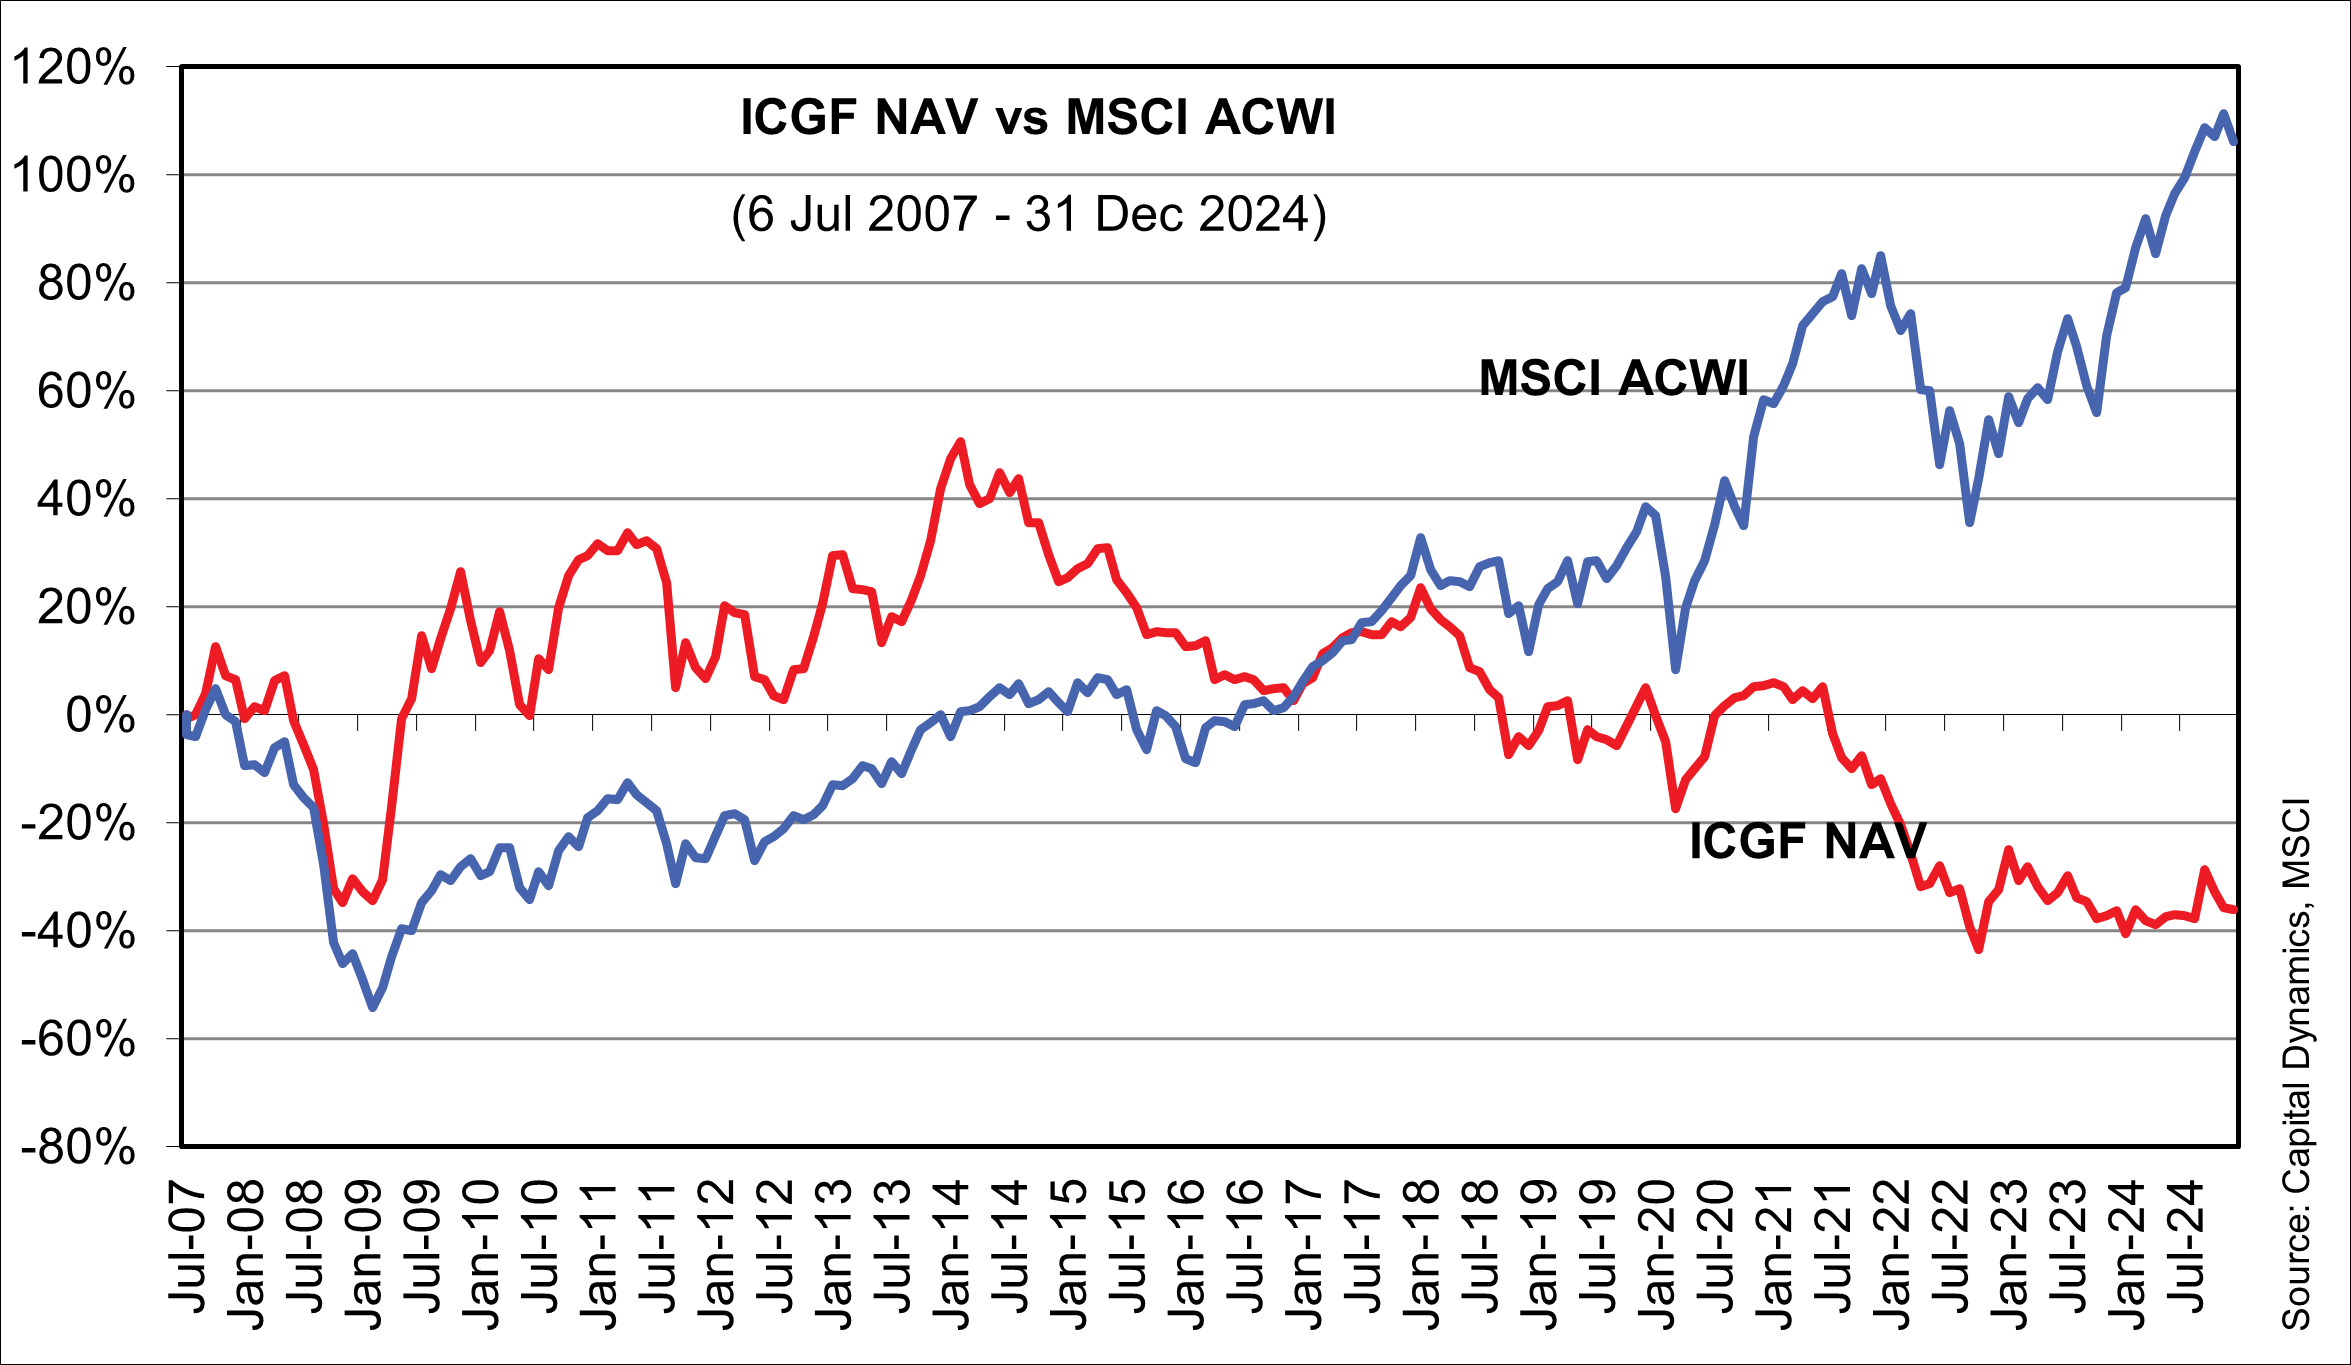
ICGF = The i Capital Global Fund.
MSCI ACWI Index: A free float-adjusted market capitalization weighted index which consists of 45 country indices, comprising 24 developed and 21 emerging market country indices.
Table 2: Cumulative % Change
| 6 July 2007 | 31 Dec 2024 | Cumulative Change % | Compound Return | |
| ICGF | US$1000.000 | US$ 639.778 | -36.02 | -2.52 |
| MSCI ACWI | 407.960 points | 841.332 points | 106.23 | 4.22 |